And the Survey Says: Job satisfaction remains high in spite of troubling issues. Despite growing concerns about tightening budgets, increased workloads, and a sometimes exasperating lack of recognition, the overwhelming majority of 24×7 readers like their jobs and would recommend their profession, according to the recently released results of our 2011 Compensation Survey.

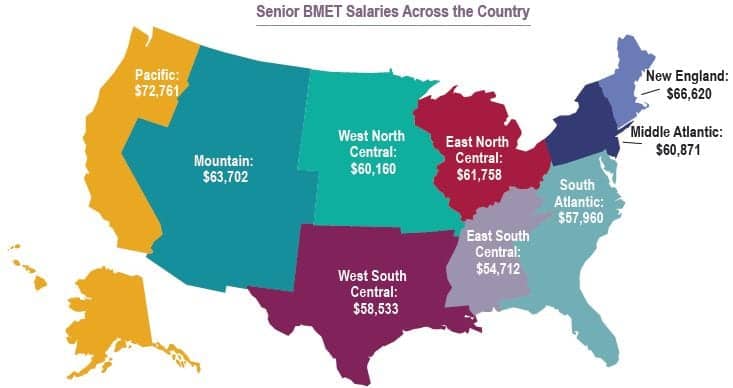
Figure 1. Average base salaries of senior BMET 3 respondents per region
Figure 2. Average base salaries per region and job title. Missing bars indicate not enough respondents to give accurate results.
An impressive 91% of the 1,022 respondents to the compensation survey said they were satisfied at work—a rating that equaled last year’s rating and is 1% higher than in 2009. This positive response becomes even more remarkable when compared to the relative job-satisfaction levels in different professions throughout America. A recent survey, titled, “I Can’t Get No … Job Satisfaction, That Is,” commissioned by the Conference Board,1 a research firm funded by about 2,000 corporations, found that only 45% of working Americans—less than half of the percentage in the 24×7 survey—expressed overall job satisfaction.
“Americans of all ages and income brackets continue to grow increasingly unhappy at work,” concluded the Conference Board survey, which was based on the answers of 2,900 respondents nationwide and marked the lowest overall job satisfaction level since 1987.
Taking a philosophical viewpoint, one clinical/biomedical engineer from the South Atlantic region spoke for many respondents when she explained why her job satisfaction remains high: “[There are] still enough positives in helping mankind in a time of need.” Another common sentiment came from a reader on the East Coast, who wrote: “What we do is interesting on a daily basis; we are always forming relationships with staff and co-workers. There is always something new to challenge our knowledge.”
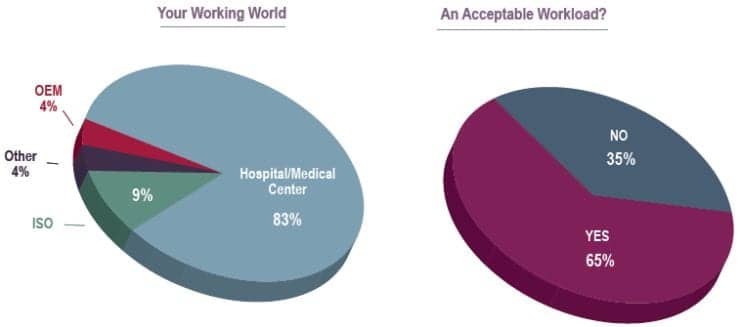
Figure 3. The percentage of respondents by employer type. Other includes home-based care, military, nonprofit, depot services, and education.
Figure 4. Percentage of respondents who feel their workoad is or is not acceptable.
Most of this year’s respondents work as biomedical/clinical engineers, specialists, managers, and directors at hospitals, OEMs, and ISOs. Others listed their employers as the military, multispecialty physician groups, depot services, engineering and research firms, dialysis clinics, educational centers, and outpatient surgery centers. Others found employment as consultants in the field. The number of professionals participating in the 24×7 survey dropped about 15% from last year. About 94% of those responding this year were male, compared to 92% last year.
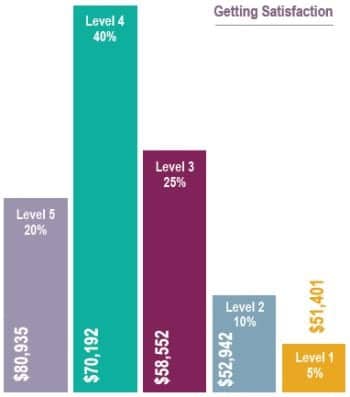
Figure 5. Salaries and satisfaction on a scale of 1 to 5, with 5 indicating very satisfied.
Concerns Remain
Overall, participants expressed satisfaction with salaries and other compensation and the overall value and importance of their work, while expressing increasing concerns over a lack of training, industry recognition, dwindling resources, and a growing workload.
“As our regional delivery system expands, the availability of resources to support it has remained static,” said one respondent with more than 16 years in the field. “We are asked to do more with proportionally less, and sooner or later, whatever resilience exists in the system to adapt will be exceeded. From my perspective, we are trying to force a previously established and arguable, successful culture to adapt to new technologies at an accelerating rate.”
A BMET 3 expressed similar concerns, saying, “Due to the way most contracts are structured and the forced downsizing of clinical engineering departments, I find biomeds in my area are doing more with less. We are not being laid off, but when a technician leaves, most often that tech is not replaced. Every month is tough from beginning to end, and we have to go into overtime to maintain the status quo.”
As expected, workers at the upper ends of the salary ranges were more likely to be satisfied with their compensation levels than those just starting in the profession. Among overall senior BMET 3 respondents, those satisfied with their salaries outnumbered those who were dissatisfied by a 10-to-one margin. Although salaries make up the majority of employee income, about 4% stated they receive other benefits (up 3% from last year), including CBET certification reimbursement, long- and short-term disability, cell phone reimbursement, gym memberships, car allowance, and paid time off.
Among the biggest concerns expressed by respondents was the workload “creep” that has many technology management professionals working longer hours. While it is still not at an epidemic stage—65% said their workload is still acceptable, down from 67% last year—it is an immediate issue for some. Those who answered “no” to workload acceptability overwhelmingly complained that there is not enough staff for the amount of equipment they are expected to maintain. Adding to this—and new this year—were numerous comments from those who have had their hours cut, making it harder to get the work done. Also, facilities and services have increased while staff has not, and there are few plans to add employees in the near future. “We have been short at least two positions for several years,” said a West Coast biomed.
Again showing up as an obstacle to completing work: requests to do additional IT or general work, which gets in the way of doing the more technical work for which they are highly trained. “Our workload is borderline,” wrote a reader from the West Coast. “IT is taking up much more time than the employer has allotted.”
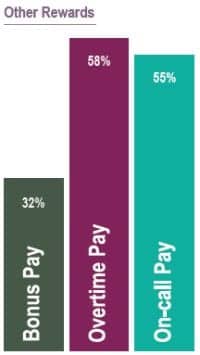
Figure 6. Percentage of respondents who receive each benefit.
A biomed from the South Atlantic region said, “We are expected to perform many administrative tasks that detract from the time needed for our primary workload.”
Other comments included a tech with 16-plus years in the field who said she carries an extra load because she has “been to a lot of training.”
An imaging tech said the overload meant “not enough time is being spent on managing contracts and our database.” And, from the Mountain region: “There is simply not enough time and personnel to handle the workload.”
What Makes it Manageable?
Overall, however, the majority of respondents were satisfied with their workload requirements. “I’m quite busy every day, but it is not overwhelming,” was a typical response. One trend that clearly surfaced in the comments was that many hospitals had moved toward more risk-based preventive maintenance inspections, which some techs felt left them more time for equipment repairs.
Those who have manageable workloads often cited good management and effective teamwork as key. Wrote one reader: “The statistical numbers and benchmarks for an x-ray/radiology service tech are not the same for biomedical techs. I’ve seen departments where management sees this and does not understand the time required to complete a standard preventive maintenance on an imaging piece of equipment. Our management team does a very good job of recognizing this. As a result, our workload is acceptable.”
A manager at a hospital with more than 400 staffed beds wrote that, “Work/life balance is part of the culture of the organization.”
For those feeling the pressure, adding personnel came in as the top suggestion on how to manage workloads, suggesting hiring both highly trained workers who can help with the technical issues and less experienced workers who could help handle the PMs and lighter work, freeing up the experienced employees to handle the advanced repairs. Other suggestions frequently echoed included:
- “A more flexible equipment management database would help.”
- “More technicians, standardized equipment in each facility, and vendor/OEM service training.”
- “When new projects come in, it is overwhelming. A project coordinator for our department would help.”
- “Software tools.”
- “More help! Hire new people sooner to train with the ones they are replacing. It’s hard to expect a kid out of school to replace someone with 40 years of experience.”
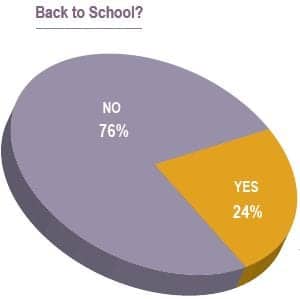
Figure 7. Percentage of respondents who are currently pursuing a formal education.
Show Me the Training
The lack of training was a sore spot among many respondents. Although it is down 2% from last year’s survey, 55% of those responding said they received less than 20 hours of training last year. This includes 66% who said they received no management training at all. Wrote one reader: “When getting hired by a new company, they always tell you they are big on education, but after you have accepted the position you often find out this isn’t the case. I’ve been with my company for 3 years, and I have yet to go to a training class. I think this is ridiculous with the technology constantly changing by the day. Companies need to focus on their workers’ competencies to adapt to the new technologies out there.”
Supporting this sentiment is the finding that only about 15% of the respondents said professional meetings and conferences are their main source of information about their profession. That is down by 2% over 2 years ago when travel budgets were larger. The Internet (38%) remains the number one source of information, although that has decreased from 40% last year. Magazines (33%) continue to be a primary resource, with journals (11%), vendors, on-the-job-training, and peers making up 3%.
Compensation satisfaction mirrors salary levels for the most part, but there were some notable exceptions in nearly all categories. One of the most surprising was the dissatisfaction of nearly 10% of the clinical engineers, who make an average of $76,750 annually. They expressed more displeasure over their salaries than did those making an average of $50,300. This might be explained by location—those on the East and West Coasts have a higher cost of living. It is also probable that those who were unhappy at $76,750 have more experience than the others making $26,000 less per year. The BMET 2 respondents reflected a similar situation, where the roughly 8% making an average of $49,534 expressed more unhappiness over their salaries than the 18% making an average of $44,727. Overall, however, salaries were acceptable to more than 80% of the respondents.
Lack of industry-wide recognition continues as a concern. “I have learned to do a great job and not expect to be appreciated for it,” one participant wrote. “One must be able to be self-directed, self-corrected, and self-instructed.”
A 5-year employee in the field agreed: “Biomedical equipment technicians need more recognition. We’re often confused with facilities maintenance people and plumbers. That’s not acceptable because of the tremendous responsibilities our job entails.”
This, coinciding with a lack of compensation for the critical work performed and, new this year, many concerns about cutbacks and the profession’s future, did lead many to say they would not recommend the profession. Comments voiced included the limited number of jobs, it’s too hard to find employment, outsourcing is a threat, and, “The job is becoming too high-stress because the future holds too little in the form of compensation increases or promotions.”
Even with these issues, overall, 24×7‘s readers are highly motivated and comparatively satisfied professionals with a widespread pride in the work they do. Wrote a respondent from Arizona: “I am incredibly proud of my profession and the company I work for.” From the Mountain states came this: “This job is never boring. There is continuous learning, but it can be a challenge.” A respondent from the East South Central region wrote: “I love the fact that I can help people solve their everyday problems, and I love figuring out how things work; taking them apart, and I love learning new things—there is never a boring week!”
Most would still recommend the profession, even with reservations, such as this imaging specialist who said, “The BMET field is an extremely important and critical partner in the delivery of safe and efficient patient care, but it in no way receives the proportional amount of respect that it deserves from management. Self-satisfaction, many times, is the only reward.”
For those who encourage others to join the field without reservation, it often comes down to helping others, as one respondent from the Pacific region said: “It is a very satisfying job with many challenges,” adding that seeing the results of the department’s contribution to clinical areas and how it helps others is rewarding.
An East North Central respondent expressed a thought that drives many in this profession: “One of the most important characteristics of our profession is a high biomedical ethic. Consider yourself or your loved one as the next patient. No compromise.”
Perhaps the overall optimism expressed in the survey was best summarized by this comment from a biomed, who wrote: “In one of the most difficult economic times in our country, I left an organization where I had gone as far as I could and moved on to an established organization. I truly felt I finally could do the work I was made to do. I am very appreciative to be in this field. I had to relocate and deal with a down real estate market, but in the end it was the best choice I’ve made in my life.”
MORE SALARY SURVEY TABLES
Salary by Job Title by Number of Years in the Field by Region
Salary by Job Title by Number of Years with Employer
Salary by Satisfaction with Compensation by Gender
Salary by Satisfaction With Compensation by Job Title
Michael Bowker is a contributing writer for 24×7. For more information, contact .
Reference
- Gibbons JM. “I Can’t Get No … Job Satisfaction, That Is.” The Conference Board, January 2010. Report number: R-1459-09-RR. Available at: www.conference-board.org/publications/publicationdetail.cfm?publicationid=1727. Accessed November 15, 2011.