
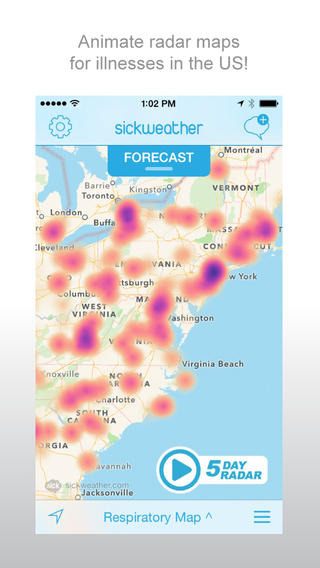
 What will they think of next? There is now a free, downloadable app that will give you a geographical map of the sickest states or illness “hot spots” in the United States, to help you avoid contagious illnesses at any time of year. Baltimore-based company Sickweather tracks illness data from social networks nationwide in real time as people go online to report their illnesses to friends and relations. The company, which qualifies over two million reports of illness each month, has produced an iPhone app that was featured as a “Best New App” for Health & Fitness in the Apple App Store this year.
The release of Sickweather’s free app arrived just in time for the current travel-heavy holiday season, which coincides with peak cold and flu season. The app includes “sickness reports” and a “sickness map,” which were produced from a study of data collected by the company’s patent-pending process to qualify reports of illness from social media. This data was then used to identify the Top 10 Sickest States and the Top 10 Healthiest States in 2014.
Sickweather’s data scientists analyzed social media reports of allergies, flu, cough, colds, and fever from January through October 2014 to create its reports. Total reports were then divided into the total population. The 2014 population estimates were provided from the US Census. In 2012, Sickweather had used similar methods to successfully identify the early start of that year’s flu season—6 weeks before the Centers for Disease Control & Prevention.
Here follow Sickweather’s reports of both the “sickest” and “healthiest” US states in 2014:
Top 10 Sickest States:
| STATE | SICK REPORTS PER THOUSAND |
| Kansas | 3.96 |
| Nevada | 3.26 |
| Kentucky | 3.25 |
| Texas | 3.10 |
| West Virginia | 2.99 |
| Oregon | 2.95 |
| Indiana | 2.91 |
| Oklahoma | 2.72 |
| Massachusetts | 2.63 |
| Nebraska | 2.48 |
Top 10 Healthiest States:
| STATE | SICK REPORTS PER THOUSAND |
| Idaho | 1.16 |
| New York | 1.16 |
| Mississippi | 1.22 |
| Montana | 1.24 |
| Vermont | 1.38 |
| Washington | 1.39 |
| Maine | 1.39 |
| New Jersey | 1.41 |
| New Hampshire | 1.48 |
| Utah | 1.48 |
The Sickweather app is available as a free download at the Apple App Store, and on Google Play.
For more information about the company, its apps, and reports, visit the Sickweather website.