In the year since 24×7’s last comprehensive survey of the compensation and job satisfaction of healthcare technology management (HTM) professionals, no dramatic new issues or concerns have emerged. The litany of challenges to the field offered by this year’s respondents will sound familiar. Among the perennial challenges and complaints named are a lack of respect for biomeds, out-of-touch and bean-counting management, excessive or ill-informed regulation, healthcare reform, budget cuts, increasing outsourcing of HTM services, uncooperative OEMs who impede the right to repair, integration with IT, the graying of the workforce, and, of course, inadequate compensation. In other words, more of the same.
[sidebar float=”right”]Download More Survey Results
For a complete look at the survey data, download a detailed top-line report that records the answers to every quantitative question asked in the survey (registration required).
[/sidebar]
What does seem to have changed, however, is the level of uncertainty biomeds feel about their line of work. For some, the sense of impending but unpredictable change in the HTM discipline is exciting. For others, it is worrisome. But whether they see doom or opportunity, all agree that significant change is coming, and that it is likely to transform the profession.
As one respondent described the situation, “I believe the profession is in flux. The leadership is graying, and there are many opportunities for advancement. However, the field is changing fast, and the profession an HTM enters today may be very different in a few years.” As for whether the change in the profession will be better or worse, the respondent simply remarked, “Can’t say.”
Despite this apparent climate of fear, uncertainty, and doubt, however, a majority of biomeds remain happy with their situation and optimistic about the future. More than 6 in 10 say they are either very satisfied or largely satisfied with their compensation, and nearly three quarters would recommend their profession to others.
Methodology
To estimate the typical salary and benefits of HTM professionals in the United States and to gauge their level of satisfaction with their jobs and employers, 24×7 conducted an online survey of its readers in September 2014. This year’s salary survey was made possible through the generous sponsorship of GE Healthcare.
Working with a leading survey company, Readex Research, 24×7 designed a 31-question survey and posted it online. On September 16, an invitation to respond to the survey was emailed to 24×7 subscribers. Reminders were mailed on September 22 and 25.
[sidebar float=”right”]
States by Region
New England
CT, MA, ME, NH, RI, VT
Middle Atlantic
NJ, NY, PA
East North Central
IL, IN, MI, OH, WI
West North Central
IA, KS, MN, MO, NE, ND, SD
South Atlantic
DC, DE, FL, GA, MD, NC, PR/VI, SC, VA, WV
East South Central
AL, KY, MS, TN
West South Central
AR, LA, OK, TX
Mountain West
AZ, CO, ID, MT, NM, NV, UT, WY
Pacific West
AK, CA, HI, OR, WA
[/sidebar]
The survey was closed for tabulation on September 29 with 1,245 responses. To best represent the audience of interest, the survey results published here are based on the 1,090 respondents who indicated that they are currently employed full-time as HTM professionals in the United States.
As a result of the high response rate to the survey, we have been able to analyze salaries across nine geographical regions in the United States, versus four regions last year. Only for a few job titles with insufficient numbers in some regions—mostly clinical engineers—are we unable to present statistically reliable salary figures. In those instances, an “N/A” is listed in place of a salary.
In all cases, salaries are presented as medians rather than averages. A median is the value that lies at the middle of a distribution: that is, 50% of the values are above it and 50% are below. Unlike an average, it represents the “typical” response, and is not influenced by extreme values.
Because the information presented here is based on self-reported data, it should be viewed as a rough guide to HTM compensation and job satisfaction, rather than an authoritative report.
Demographics
Respondents who identify as BMETs 1, 2, or 3 account for 50% of those participating in this year’s survey. Those whose titles are equivalent to “manager” made up 16% of respondents, while radiology equipment specialists accounted for 13%. None of the remaining job title categories—director/executive, clinical engineer, or “other”—exceeded 8%.
As was the case in last year’s survey results, the field remains heavily tilted toward older employees, with more than half of respondents indicating that they are age 50 or older. As will be discussed later in this article, this skewed distribution of ages is at significant variance from the age distribution of the workforce as a whole in the United States, and poses a significant challenge for HTM departments.
The field is similarly dominated by men. In last year’s survey, just 8% of respondents indicated that they were women. This year, 9% said they are female. While those in favor of greater gender equity might take heart at this increase, the apparent increase may not be statistically significant. However, one woman respondent complained of gender bias in her department, and another wrote that healthcare technology management is “NOT a good career for women.”
Geographically, the bulk of the respondents came from either the Midwest (31%) or the South (32%), while the Northeast and West accounted for 16% and 19%, respectively (2% did not answer).
Compensation

Median base salaries by job title nationwide. (Click to enlarge.)
Nationwide, HTM salaries range from $43,000 for the BMET 1 job title to $110,000 for those with director-level or executive positions. In terms of regional pay, the West is apparently the best: Senior-level BMETs on the Pacific Coast earn a median salary of $75,000, more than $10,000 better than the national median of $64,600, and $19,000 more than their peers in the East South Central states of Kentucky, Tennessee, Alabama, and Mississippi.
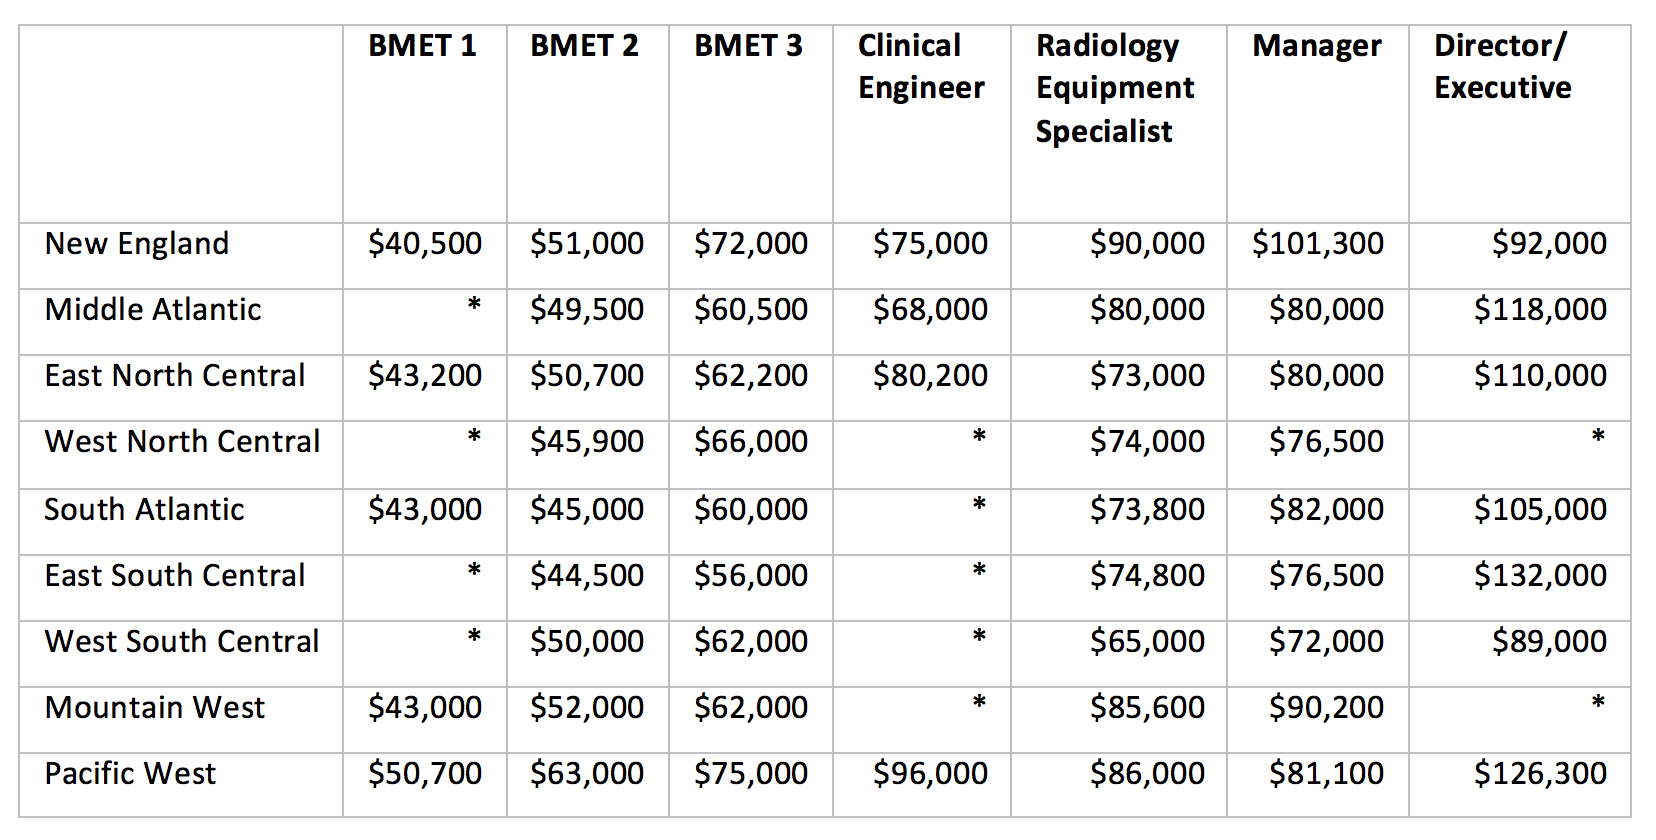
Median base salaries for HTM job titles by region. (Click to enlarge.)
Although their effect varies significantly by job title, several other factors seem to play a significant role in salary differentials. Not surprisingly, education is one notable influence on earning power. Overall median salaries (that is, for all job titles nationwide) range from a low of $64,500 for respondents with AAS degrees to a high of $85,800 for those with postgraduate degrees. Respondents with military training or bachelor’s degrees are in the middle of the range, earning mean salaries of $70,000 and $74,000, respectively. As was the case last year, however, only about 2 in 10 respondents are pursuing further formal education, despite the apparent earnings advantage.
The type of employer also makes a difference in earnings. At $67,000 annually, respondents working for hospitals, medical centers, and medical systems earn $2,000 more than those working for independent service organizations. Both were out-earned by employees of medical device manufacturers, who make a median annual figure of $85,000. The size of the HTM department respondents work for makes a difference as well. Those who work for small departments with fewer than five biomeds report median salaries of $64,500, while members of departments with more than 15 members earned $80,000.
Finally, the gender gap still exists. With an annual median salary of $60,000, women earn about $9,000 less than men overall. However, that gap disappears in entry- and mid-level positions such as BMET 1 and 2, where females out-earn their male counterparts by about $2,000.
In general, the HTM professionals responding to this survey reported excellent benefits. This is one of the few areas where the survey produced significantly changed results from last year. Whereas last year 90% of respondents reported receiving health insurance, this year that number is dramatically improved, at 99%. Out of nearly 1,000 respondents in total, only two reported receiving no benefits at all. These increases are born out with other types of employer-based insurance, with 97% eligible to receive dental insurance versus 89% last year, and 90% for vision insurance, versus 80% a year ago.
Workload
As was the case last year, about two-thirds of respondents described their workloads as heavy or excessive. When asked the reason for their heavy workloads, they generally blamed either a lack of staff or unreasonable expectations from upper management. One respondent noted that, “Our facility has grown dramatically since I became an employee here. The amount of equipment the biomed department is responsible for has grown from around 2,000 pieces to over 7,000 pieces. Yet our department continues to have only four full time employees.” Another blamed “the ‘consultants’ who somehow determined that 1,600+ devices per technician is an acceptable load, and the C-suite buying into that number because, again, they really don’t understand what it is we actually do.”
Job Satisfaction
In this year’s survey, respondents were asked to rank their satisfaction with their salary from 5 (very satisfied with their salary) to 1 (very unsatisfied). A solid majority, 61%, indicated a high level of satisfaction, either 5 or 4. Just 13% chose a 1 or 2, indicating dissatisfaction with their pay. When to rank how fairly they believe they are compensated with respect to their education and experience on the same scale, 58% responded that their compensation is very fair with respect to their education (5 or 4), while exactly half said they were fairly compensated with respect to their level of experience. As was the case last year, about one quarter of respondents indicated they are looking for employment elsewhere.
When asked what they like least about their jobs, respondents cited a range of problems. Many complain about an excess of paperwork and administrative duties, the “constant pressure to do more with less,” and “micromanagement of meaningless employee metrics.” As always, many object to the lack of respect and understanding of their roles. As one put it, “I do not like be treated as the lowest life-form in the hospital.”
As for the positive side of their work, the respondents used words like autonomy, freedom, variety, flexibility, and diversity. As one put it, “Each day is different and challenging. I never know what I am going to be working on at any moment. And there isn’t a day that goes by that I don’t learn something new, either about the equipment or about myself.” Others talked about the rewards that come from the human side of a supposedly geeky job. As one biomed wrote, “In my opinion, the ‘service’ business is 30% technical know-how and 70% relationships. We wouldn’t be in this field if we didn’t genuinely care about helping others. The relationships, working together, and being treated as an equal in the delivery of high-quality, cost-effective health care are what I like most about my position.”
Key Challenges for the Profession
Whether they regard the prospects for their profession with excitement or trepidation, all the respondents to the survey appeared to agree that the biomedical discipline faces significant challenges with no clear resolution. Those issues include such much-discussed topics as device connectivity, the integration with IT, excessive regulation, the outsourcing of HTM services, and OEMs interfering with what biomeds consider their right to repair equipment their facilities own.
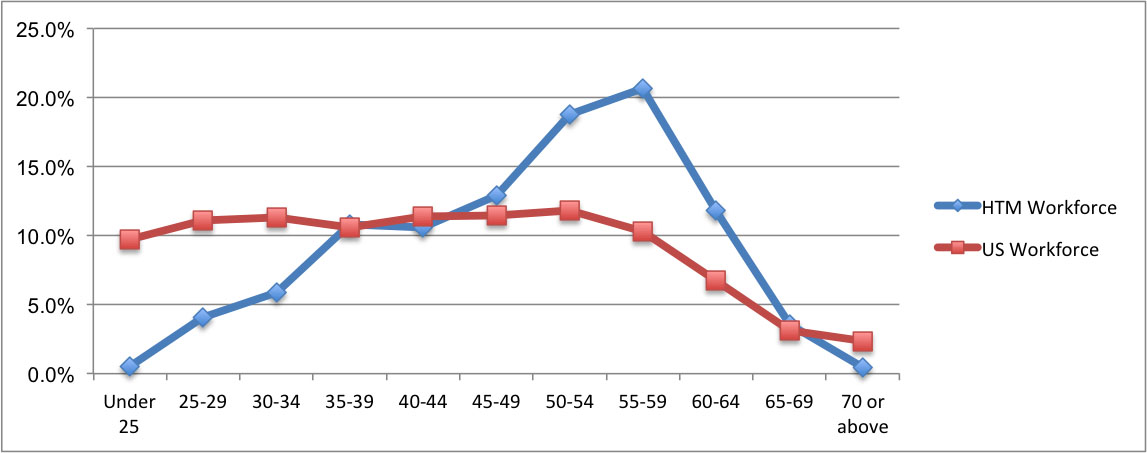
Distribution of HTM workforce by age compared with total US workforce. (Click to enlarge.)
Most of these challenges have been discussed at length in previous issues of 24×7. One in particular, however, deserves mention here because it is reflected in the survey findings: the aging of the HTM workforce. For the first time this year, our survey asked respondents to give their age. When the results are placed on a line graph, as shown in the accompanying figure above, they show a dramatic peak at ages 55 to 59, which comprise 21% of the respondents. Workers aged 50 or older altogether account for 56% of the HTM workforce measured by this survey. This contrasts strongly with the age distribution of the general US workforce, which is more or less evenly spread out from age 20 to 60.
Looking Forward
Though the kind of rapid and categorical change that our respondents anticipate can be frightening, many find the challenges bracing. One respondent wrote, “With technology constantly evolving, we are constantly experiencing new equipment, new disposables, new processes, new clinical techniques that continually push the boundaries of what we support.” That pushing of boundaries, however, brings its own unique rewards that keep the biomed business appealing, as the respondent noted: “I’ve been in the healthcare technology field for over 20 years, and I still find it to be new and exciting.” 24×7
John Bethune is editorial director of 24×7. He can be reached at [email protected].