By John Noblitt, MAEd, CBET
 In this article I will examine cardiac output measurements, the output curves, and the problems indicated. In a previous article on this topic, I wrote about the different ways cardiac output can be determined and factors that may influence those measurements. I touched on how cardiac output is determined, with emphasis on the most commonly used method: thermodilution.
As you may remember, cardiac output is a measure of how much blood is pumped by the heart in liters per minute, with normal outputs in a range from 4 to 8 liters per minute. It is computed as stroke volume times the heart rate. The previous article did not go into the clinical aspects of what the waveforms would look like and what you may encounter as a BMET working in the hospital. Ideally, this article will help shed light on these topics, which may well find their way into a certification exam question.
The Thermodilution Curve
We determine cardiac output by injecting a cold bolus of a sterile solution into the patient’s bloodstream through a Swan Ganz catheter. A thermistor near the distal end of the catheter senses the change in temperature as the injectate passes the catheter tip located in the pulmonary artery. A temperature curve is created by the cold injectate passing the thermistor, which of course changes its resistance as the temperature changes.
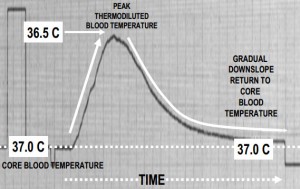
Here’s one of the things you should remember about a thermodilution temperature curve when associated with cardiac output: The cardiac output is inversely proportional to the area under the curve. Therefore, a good cardiac output will produce a curve with a small area. A patient with a poor cardiac output would produce a large area under the curve. This is because the catheter thermistor sees temperature changes over a longer period of time, creating a larger area under the curve.
As you can see by the thermodilution curve below, the upward slope is very steep while the downslope is gradual. This reflects the cold bolus solution passing the thermistor rapidly and the thermistor returning more gradually to the normal core temperature of the blood.
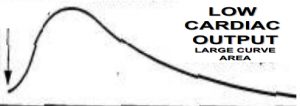
The dilution curve below displays a sharp change in temperature at the beginning of the waveform. The gradual downslope and the large area under the thermodilution curve indicate low cardiac output, a result of the cold injectate passing by the thermistor for a longer period of time than with higher cardiac output.
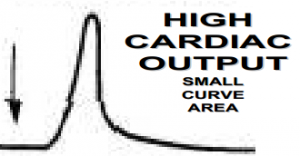
In the next dilution curve, below, we see the rapid rise at the beginning of the curve, representing the cold injectate passing the thermistor. We then see a steep downslope, which indicates a rapid return of the thermistor to the core blood temperature. This rapidly returning temperature reflects higher blood flow, and thus higher cardiac output.
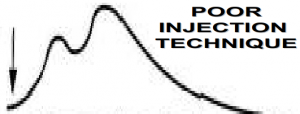
A common problem with cardiac output measurements is improperly administering the injectate. The dilution curve below shows how an improper injection technique may show up on the cardiac output themodilution curve. The dip in the upward slope indicates a noncontinuous injection of the cold solution. This user error will produce a large area under the curve, but does not necessarily indicate a lower cardiac output or a problem with the heart.
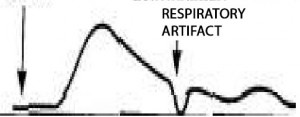
Another problem you could see in a thermodilution curve is a respiratory artifact, which is shown in the graph below. This problem can be found when measurements are not timed correctly with the respiration cycle. Patients who are on mechanical ventilation may have a higher incidence of this artifact in the dilution curve.
Other Measurement Problems
Other difficulties in obtaining proper measurements can be seen in patients with tricuspid or pulmonic valve regurgitation. In these patients, the injectate may be recirculated across the faulty valve. Patients with severe tricuspid regurgitation can show abnormally long temperature decay times, which would indicate an erroneous low cardiac output.
Still other inaccuracies in cardiac output measurements may stem from intracardiac shunts placed in the heart of the patient. Patients with right-to-left shunts may have early recirculation of the injectate, which can be seen as a distorted downward slope of the thermodilution curve. In patients with left-to-right shunts, the injectate may bypass the thermistor. Both of these conditions can cause an overestimation of the cardiac output.
I hope you find this information useful in your preparation for the certification exam.
Review Questions
1) The most widely used method to determine cardiac output is:
a) Thermodilution
b) Dye dilution
c) Stress test
d) Arterial pulse analysis
2. Large areas under the cardiac output thermodilution curve is an indication of:
a) High cardiac output
b) Low cardiac output
c) No cardiac output
d) Atrial fibrillation
3) Patients with a left-to-right stent can display this type of CO measurement:
a) High
b) Low
c) Normal
d) No measurement can be detected
4) One of the most common problems with obtaining accurate cardiac output measurements is:
a) Improperly calibrated monitor
b) Improper catheter used
c) Improper injectate administration
d) Injectate not iced down properly
CORRECTION
Thanks to reader Frank Nickells, who pointed out an incorrect quiz answer in this column in the June 2014 issue. The correct answer to question 2 about the reason for photo timing is not A, ”Keep the physician aware of how long a patient has been exposed to radiation” but B, “Terminate x-ray exposure.” It’s nice to know people are reading the ICC Prep articles with a keen eye.
John Noblitt is the BMET program director at Caldwell Community College and Technical Institute, Hudson, NC. For more information, contact editorial director John Bethune at [email protected].
Answers: 1—A, 2—B, 3—A, 4—C


